
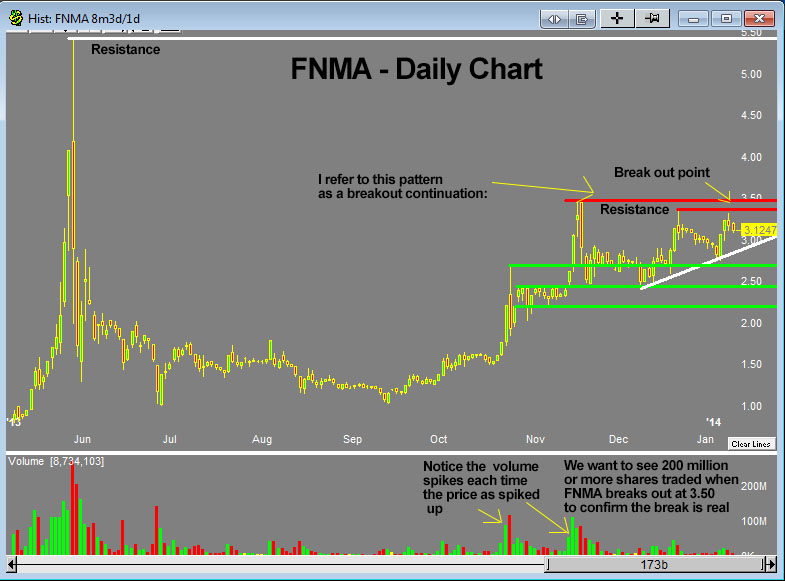
I was analyzing stock charts the other day for high probability trading opportunities and I came across FNMA. Federal nation Mortgage Association, aka Fannie Mae, has been setting up for a few months and I believe is ready to make a big move to the upside. I really like the looks of this stock chart because it is forming a stock setup I refer to as the breakout continuation pattern which in the past has been very profitable for me for both day trades and 2 to 5-day swing trades.
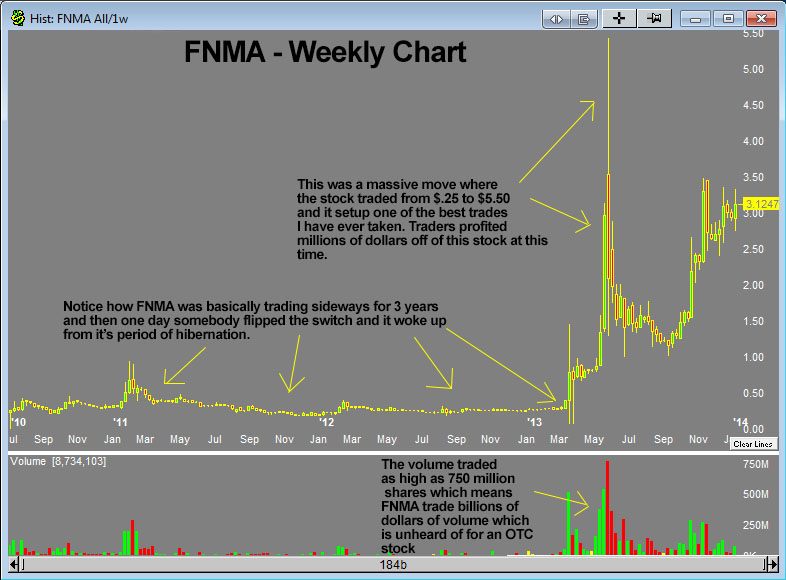
Back at the end of May 2013, FNMA made an incredible move where it spiked up from $.25 to $5.50 in less than a week. I made a lot of money both buying and shorting this stock during that time along with a few other occasions over the past 5 months. In a few days during May 2013, it traded literally billions of dollars worth of volume. This is the first time in 10 years I have ever seen an OTCBB stock (over the counter bulletin board stock) which traded this much volume. Most penny stocks that trade on this exchange are illiquid and are lucky if they trade $50k worth of volume per day, but FNMA is a different sort of beast with a lot of eyes on it. Not to mention most OTCBB stocks are pure scams whereas FNMA was one of the largest providers of mortgages in the U.S. before the financial crisis in 2007 when it got slammed to $.05 a share.
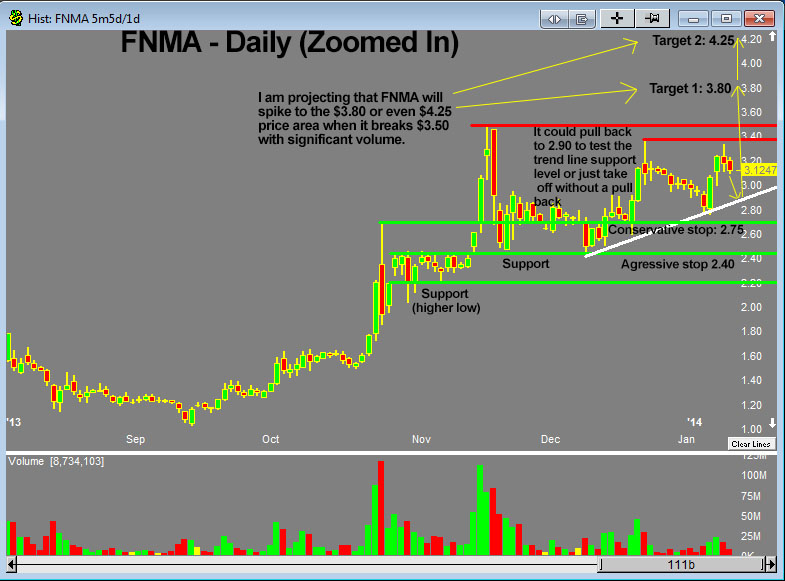
I think that if FNMA can breakout above its previous high around $3.50 (it’s currently at 3.12) it is headed to my first target of $3.80 where it may stall or pull back a bit and then continue to $4.25. before the breakout, FNMA may try to pull back to $2.90, possibly during the next trading session 1/13/2014 although if the buying volume spikes, it could just head straight for the breakout point at $3.50. When I enter I will place my stop loss at $2.75. Patterns like this work because of the way that markets function. There is a battle between sellers and buyers taking place in stocks at all times and when the demand (buyers) for a stock exceeds the supply by a large amount, you can get large moves. This is magnified in low-priced stocks which allows for huge price swings. When triggered, the stop-loss orders of short-sellers above $3.50, combined with the buy orders of breakout buyers, should send this to $3.80 or higher as the forced buy to cover orders hit the market causing a short squeeze. I will ride the wave and extract my profits at this time.
The reason for the big spike was that some hedge funds were allegedly going to buy FNMA out. The reason for the sell-off besides the typical mean reversion nature of stocks that make huge moves is the fact that someone came out and said that FNMA would actually be retired and new equity would be issued essentially wiping out the current stockholders. During that time many institutions were involved in trading FNMA even though most people believe they won’t touch stocks under $5.00. Since this volume and corresponding price spike, there is no way that this stock would be able to spike as much as it did without these key players.
As I said last time with my trade in ZNGA, there is no guarantee that I am correct with my analysis. This stock could implode or it could even do nothing for the next few months but my 10 years of experience tells me what typically occurs when this pattern forms and therefore I wanted to send out this email to help people understand how real traders operate and make the decisions to buy or sell. My trading system helped me find this setup and also helped me a project where the stock is potentially headed along with where to place a stop loss if I am wrong.
Please note this is not an “investment”. I have no idea what this stock will do in the long term and I am not suggesting anyone just randomly buy and hold this stock. There are much better companies to buy and hold which actually earn a profit right now. I am a trader. I look for specific patterns I am familiar with and look to extract realistic profits in a defined period of time when my technical trading system tells me the probabilities are in my favor. Please have a look at the charts below. Make sure you can view images in your email account.
FNMA – Weekly Chart
The market has not been this hot in a long time! Start learning how to profit in penny stocks consistently. To get started trading stocks like FNMA: click here